

WARNING: This article has been written to motivate myself, understand the process more deeply and to increase my command of the tools I will use throughout the article. It is possible that you will see unnecessary details in the article.
Hi Everyone,
In this article, I will cover the analysis process of native libraries and the hooking process to bypass some sample detection methods. I will show about the dynamic, disassemble and debugging analysis processes of the native package that I wrote.
Efficiency aside, native libraries prolong and complicate the analysis process. The reason for this is that these libraries prepared in C, C++, Rust, Dart etc. languages are compiled and traced through the disassemble process. The main purpose of this article will be to intervene in the JNI, which acts as a bridge between Java and C++, and turn the process in our favor.
Let’s start!
TARGET ?.SO
NOTE: There may be cases where the memory addresses you will see throughout the article are different from the addresses in the GIF. You can focus on the last 3 values.
The target application can have multiple native libraries, you can see multiple System.loadLibrary functions in Java classes. If there is no meaning from the name of the lib, what should be the path to follow?
For example, the libs uploaded to a remote target process via gdb are listed below. The files listed here are native libraries of system and app.
From        To         Syms Read   Shared Object Library
0xd0951a50  0xd0970b4d  Yes (*)     target:/system/vendor/lib/libGLESv1_enc.so
0xd09a01f0  0xd09b1032  Yes (*)     target:/system/vendor/lib/libOpenglCodecCommon.so
0xd08e2490  0xd08e8584  Yes (*)     target:/system/vendor/lib/egl/libGLESv1_CM_emulation.so
.           .           .           .
.           .           .           .
0xd08aa490  0xd08aa618  Yes (*)     target:/data/app/com.hebun.nativesample-ExryU5zGoSK__RQfRENZXw==/lib/x86/liby.so
0xd0842490  0xd0842618  Yes (*)     target:/data/app/com.hebun.nativesample-ExryU5zGoSK__RQfRENZXw==/lib/x86/libx.so
0xd080df20  0xd0816e84  Yes (*)     target:/system/vendor/lib/egl/libGLESv2_emulation.so
Finding the function triggered by frida-trace is actually very easy. For example, the function triggered after “Java_com_*” filtering is listed below. But as I mentioned at the beginning of the article, I will examine this process in more depth. Also, you will see that frida-trace alone will not be enough for the hooking process.
Java_com_hebun_nativesample_MainActivity_y: Auto-generated handler at "/mnt/c/Users/hebun/Desktop/__handlers__/liby.so/Java_com_hebun_nativesample_Main_e2cce692.js"
Java_com_hebun_nativesample_MainActivity_x: Auto-generated handler at "/mnt/c/Users/hebun/Desktop/__handlers__/libx.so/Java_com_hebun_nativesample_Main_95cbd604.js"
Started tracing 3 functions. Press Ctrl+C to stop.
           /* TID 0xc19 */
  5134 ms  Java_com_hebun_nativesample_MainActivity_x()
Exported lib will be triggered and data will be returned with two buttons in MainActivity. Then this value will be commented on the TextView. Scenario; The target lib will be detected via the button to be triggered. This will happen with frida.
        buttonX.setOnClickListener(new View.OnClickListener() {
            @Override
            public void onClick(View view) {
                loaded.setText(x());
            }
        });
        buttonY.setOnClickListener(new View.OnClickListener() {
            @Override
            public void onClick(View view) {
                loaded.setText(y());
            }
        });
The Interceptor.attach method was used to use Frida as a proxy. findExportByName was used to define the function to be intercepted. Due to the scenario, the target native library is not known, so a null value was passed. This will list all installed libraries. Of course, to reduce the cost, we will list the newly installed shared libraries using the android_dlopen_ext definition.
The process hooked up with Frida gave both libraries targeted as log output.
Interceptor.attach(Module.findExportByName(null, 'android_dlopen_ext'),{
    onEnter: function(args){
        var library_path = Memory.readCString(args[0])
        console.log("\n[...] Loading library : " + library_path)
    }
})
[...] Loading library : /data/app/com.hebun.nativesample-ExryU5zGoSK__RQfRENZXw==/oat/x86/base.odex
[...] Loading library : /data/app/com.hebun.nativesample-ExryU5zGoSK__RQfRENZXw==/base.apk!/lib/x86/liby.so
[...] Loading library : /data/app/com.hebun.nativesample-ExryU5zGoSK__RQfRENZXw==/base.apk!/lib/x86/libx.soI used the enumerateExportsSync method to detect the addresses of the exported module. After hooking with Frida, 2 different addresses for both libraries, 4 different addresses in total should be output.
The first memory address is the start address of the target function and the last is the return methods.
onLeave: function(args){
  if(library_loaded ==  1){
     console.log("[+] Loaded")
     var libs = library_path.slice(66);//For raw data only
     Module.enumerateExportsSync(libs).forEach(function(symbol){
          console.log("[...] For "+ libs + " Address -> "  + symbol.address)
[+] Loaded
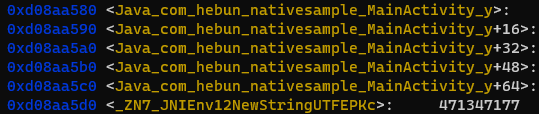
[...] For liby.so Address -> 0xd08aa580
[...] For liby.so Address -> 0xd08aa5d0
[+] Loaded
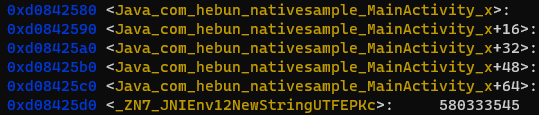
[...] For libx.so Address -> 0xd0842580
[...] For libx.so Address -> 0xd08425d0When the output addresses are examined over gdb, the target function emerges. Here, it has been seen that the addresses of the libs that are called when the target process is opened are the same.
Now we will need to find out which of these functions is triggered. So, we will intercept the relevant addresses.
var libs = library_path.slice(66);//Just to get the raw data
Module.enumerateExportsSync(libs).forEach(function(symbol){
     Interceptor.attach(symbol.address,{
       onEnter: function(args){
       		console.log("[...] Triggered Address -> " + symbol.address)
Let’s deal with this process with real scenarios…
For example, assuming a root detection function is in the native library, it is necessary to detect the lib file that is triggered when the application is opened. But since the addresses of the methods to be used for root detection are also listed, I have difficulty in determining the actual address.
When I hook it with Frida, I detect many addresses belonging to the target native library. But since all detected addresses are passed through the intercept, Frida error message gives an invalid address warning. I’m not entirely sure about the problem here, but I think this output is given because every method cannot be intercepted.
.
[...] For libzxc.so Address -> 0xc83b6774
[...] For libzxc.so Address -> 0xc838de00
[...] For libzxc.so Address -> 0xc83b6b48
[...] For libzxc.so Address -> 0xc838dd30
.
.
.
Process crashed: Bad access due to invalid address

***
*** *** *** *** *** *** *** *** *** *** *** *** *** *** *** ***
Build fingerprint: 'Android/vbox86p/vbox86p:8.0.0/OPR6.170623.017/77:userdebug/test-keys'
Revision: '0'
ABI: 'x86'
pid: 2797, tid: 2797, name: un.nativesample  >>> com.hebun.nativesample <<<
signal 11 (SIGSEGV), code 1 (SEGV_MAPERR), fault addr 0xa903d764
    eax 00000000  ebx ced7530c  ecx e777c0a8  edx a903d764
    esi e777bfb8  edi 00000000
    xcs 00000023  xds 0000002b  xes 0000002b  xfs 0000006b  xss 0000002b
    eip cde94de2  ebp ffd245b8  esp ffd245b4  flags 00010246
The addresses of the target function are detected with symbol.address. But looking at the example above, it becomes difficult to find the function over gdb with too many addresses.
I prepared a regexp according to the output by adding symbol.name in addition to symbol.address. F/P might cause a situation but mainly I didn’t Intercept the values starting with “_” which I don’t need and I was able to detect the target root detection function.
if (!/(?:\s|^)_/.test(symbol.name)) {
    console.log("[...] For " + libs + " Address -> " + symbol.address + " | Function Name -> " + symbol.name)
    Interceptor.attach(symbol.address, {
        onEnter: function(args) {
            console.log("[...] Triggered Address -> " + symbol.address)
            console.log("[...] Triggered Function Name -> " + symbol.name)
        }
    })
}
[...] Loading library : /data/app/com.hebun.nativesample-flUc-LjVfrJUEz_RD6IAKA==/lib/x86/libzxc.so
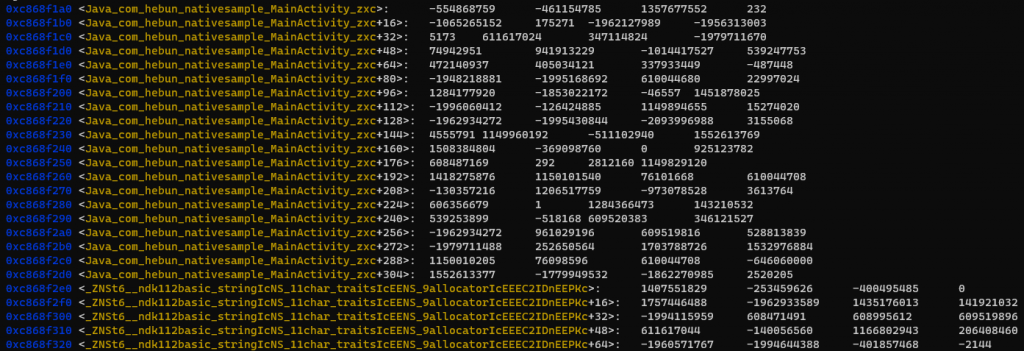
[...] For libzxc.so Address -> 0xc868f1a0 | Function Name -> Java_com_hebun_nativesample_MainActivity_zxc
[...] Triggered Address -> 0xc868f1a0
[...] Triggered Function Name -> Java_com_hebun_nativesample_MainActivity_zxcWhen the triggered address 0xc868f1a0 was examined via gdb, it was found that it matched the function corresponding to the target symbol.name.
DISASSEMBLE TARGET LIB
In the previous subtitle, the target library and the function triggered in the library were determined. Now we will analyze the exported file with the disassembly tool.
After disassembling the detected function in Intel format, I targeted critical instructions; CALL, CMP, JUMP, J*(conditions) and MOV(not all).
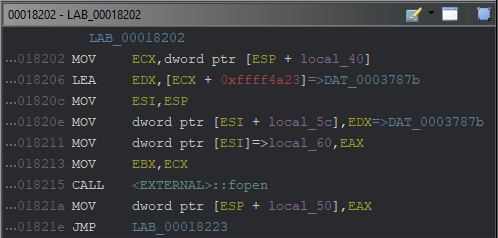
Using the fopen method means reading or writing a file in the system. There are two different variables that the called method takes;
file*fopen(const char *filename, const char *mode)When going to the reference address (0x0003787b) of the EDX register, the string value “r” is seen. This means that the mode of the fopen method is read. Now, I will trace the EAX register for the filename used in the fopen method.
It can be assumed that for the value of EAX to correspond to the ‘filename’ parameter, the call pattern of the function must be FASTCALL, although not exact.
mov ecx, 2
mov edx, 3
call x       ; x(2,3)
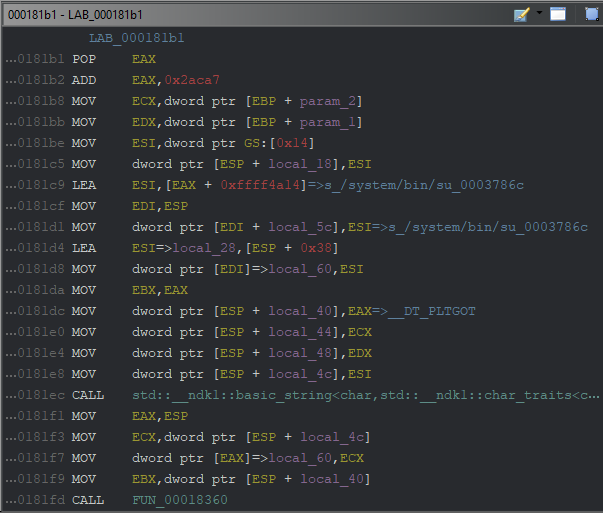
Therefore, it is necessary to focus on updates between ECX and EAX registers.
As a result of the calculation at offset 0x000181c9, the file to be read at address 0x0003786c has been loaded to ESI(via LEA). Then the esp+local_4c pointer is updated with this value and defined to the ECX register at address 0x000181f3. Finally, the EAX pointer (*local_60) gets the corresponding address from the ECX.
When two string values are defined to fopen, we get the following result;
file*fopen("/system/bin/su", "r")
If the user u0_a* can read the "su" file with the fopen method (ie if the file exists), the corresponding function will return a value. Of course it will be loaded via a pointer;
$eax : 0xeef0a00c → 0x00000000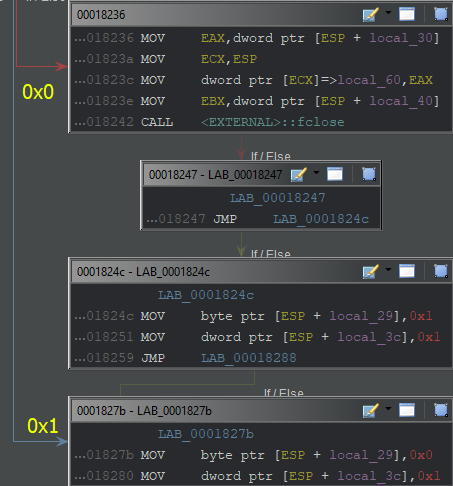
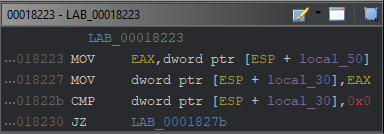
The EAX register defined in the stack is then compared with 0x0. If it matches, it will jump to 0x0000827b and continue the process. At the relevant address, a value of 0x1 will be loaded into an area of the stack.
But if it does not match 0x0, the EAX register will continue at 0x00008236. Here, it is seen that the fclose method is used.
int fclose(FILE *stream)After the FILE object is read, fclose closes the file stream. It is seen that a 0x1 value is loaded into a field in the stack point by completing the jumping operations. To summarize the situation;
- If the file exists and has read permission: 0x1
- If the file does not exist or is unreadable: 0x0
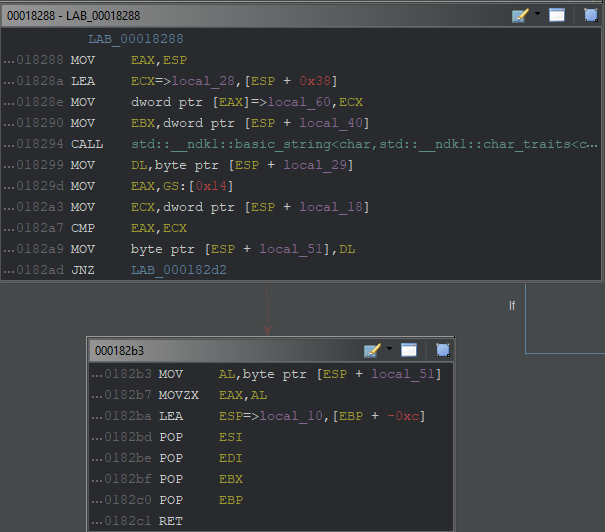
After adding the True/False value to the stack point, it is loaded into the DL register. Then again, the value of the DL register is loaded into a field in the stack point.
Finally, the value loaded into the AL register is defined to EAX and cleared with POP and the value is returned.
I don’t want to mention the last CMP part; shows the message that will appear in case of a stack overflow.
It was detected that a boolean value was returned as a result. The content of the next topic will be to attach and debug this application, which will be installed on my rooted AVD, with gdbserver.
ANALYZE VIA DEBUGGING
In this subtitle, we will cover about the debugging process of the detected lib file while the application is running. In this process, as in the previous topic, we will follow the interaction of register and stack with instructions.
I stopped the process by adding a breakpoint to the root detection function that will be triggered when the application is opened. Detected as address 0xd52141a6 in function Java_com_hebun_nativesample_MainActivity_zxc.
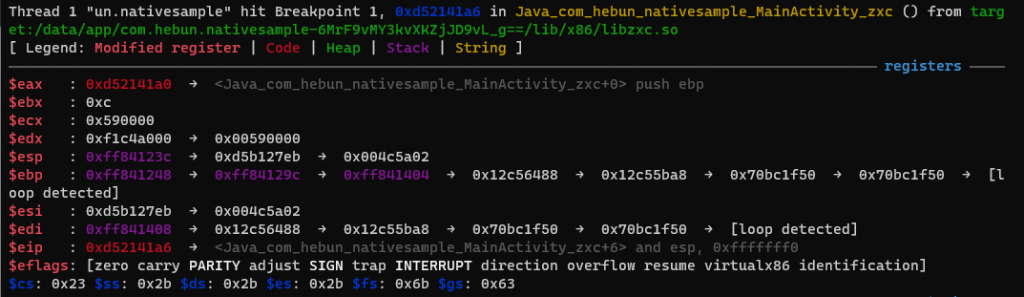
The address after the eax-0xb5ec calculation is saved in the ESI register. In the previous topic, we saw that the “/system/bin/su” file was marked after this calculation. Better make a note of 0x7379732f. Because soon the ESI register will be updated with the stackpoint’s address at offset 0x38.


After the function at address 0xd5214360 called at offset 0xd52141fd, update EAX to address 0xe5f10920. When we look at the address it pointed, we see the following; 0x7379732f➤”/system/bin/su”…


You have seen in the previous subtitle that because of FASTCALL it addresses EDX’s mode and EAX’s filename objects. The 0xd523387b address that emerged after the ecx-0xb5dd calculation points to the 0x61620072 address(string value “r”).


The CMP operation that takes place to check if fopen has read the file has progressed by comparing the pointer at esp+0x30 and the value 0x0.
When the relevant field on the stack was checked, 0xf1c0a00c address appeared. When this address is examined on the stack point, it has been determined that it shows the 0x00000000. As a result, continued at 0xd5214236.


The esp+0x37 address is defined as 0x1 in bytes. This value is then defined in the DL register. You remember the importance of this register in the previous title. It can be said that one of the first actors in defining the boolean value that will return with the RET instruction.
When the boolean value in which the DL register was updated was analyzed, it was seen that 0x1(true) was defined. We do not need to follow the next register assignments. We know that it will be updated to the AL register in the previous title, and then loaded to the EAX register.
When I continue the process with the state before editing the DL register, a root detection warning appears. But when I edit it as 0x0, it states that my device is not rooted.


HOOKING JNIENV POINTER
In the first title, we determined the offset of the triggered function. Now I will try to hook the boolean value that the function will return. Of course, before that, I want to touch on the detection process of the functions used in JNIEnv.
Let’s remember libx.so’s function; Java_com_hebun_nativesample_MainActivity_x. The standard for this function is as follows;
extern "C" JNIEXPORT jstring JNICALL
Java_com_hebun_nativesample_MainActivity_x(JNIEnv *env, jobject thiz)
The job of the JNIEnv parameter is a JNI environment variable that provides access to all JNI functions. The functions in this array list will give us the type of the return value.
const JNINativeInterface = [ "NULL", "NULL", "NULL", "NULL", "GetVersion", "DefineClass", "FindClass", "FromReflectedMethod", "FromReflectedField", "ToReflectedMethod", "GetSuperclass", "IsAssignableFrom", "ToReflectedField", "Throw", "ThrowNew", "ExceptionOccurred", "ExceptionDescribe", "ExceptionClear", "FatalError", "PushLocalFrame", "PopLocalFrame", "NewGlobalRef", "DeleteGlobalRef", "DeleteLocalRef", "IsSameObject", "NewLocalRef", "EnsureLocalCapacity", "AllocObject", "NewObject", "NewObjectV", "NewObjectA", "GetObjectClass", "IsInstanceOf", "GetMethodID", "CallObjectMethod", "CallObjectMethodV", "CallObjectMethodA", "CallBooleanMethod", "CallBooleanMethodV", "CallBooleanMethodA", "CallByteMethod", "CallByteMethodV", "CallByteMethodA", "CallCharMethod", "CallCharMethodV", "CallCharMethodA", "CallShortMethod", "CallShortMethodV", "CallShortMethodA", "CallIntMethod", "CallIntMethodV", "CallIntMethodA", "CallLongMethod", "CallLongMethodV", "CallLongMethodA", "CallFloatMethod", "CallFloatMethodV", "CallFloatMethodA", "CallDoubleMethod", "CallDoubleMethodV", "CallDoubleMethodA", "CallVoidMethod", "CallVoidMethodV", "CallVoidMethodA", "CallNonvirtualObjectMethod", "CallNonvirtualObjectMethodV", "CallNonvirtualObjectMethodA", "CallNonvirtualBooleanMethod", "CallNonvirtualBooleanMethodV", "CallNonvirtualBooleanMethodA", "CallNonvirtualByteMethod", "CallNonvirtualByteMethodV", "CallNonvirtualByteMethodA", "CallNonvirtualCharMethod", "CallNonvirtualCharMethodV", "CallNonvirtualCharMethodA", "CallNonvirtualShortMethod", "CallNonvirtualShortMethodV", "CallNonvirtualShortMethodA", "CallNonvirtualIntMethod", "CallNonvirtualIntMethodV", "CallNonvirtualIntMethodA", "CallNonvirtualLongMethod", "CallNonvirtualLongMethodV", "CallNonvirtualLongMethodA", "CallNonvirtualFloatMethod", "CallNonvirtualFloatMethodV", "CallNonvirtualFloatMethodA", "CallNonvirtualDoubleMethod", "CallNonvirtualDoubleMethodV", "CallNonvirtualDoubleMethodA", "CallNonvirtualVoidMethod", "CallNonvirtualVoidMethodV", "CallNonvirtualVoidMethodA", "GetFieldID", "GetObjectField", "GetBooleanField", "GetByteField", "GetCharField", "GetShortField", "GetIntField", "GetLongField", "GetFloatField", "GetDoubleField", "SetObjectField", "SetBooleanField", "SetByteField", "SetCharField", "SetShortField", "SetIntField", "SetLongField", "SetFloatField", "SetDoubleField", "GetStaticMethodID", "CallStaticObjectMethod", "CallStaticObjectMethodV", "CallStaticObjectMethodA", "CallStaticBooleanMethod", "CallStaticBooleanMethodV", "CallStaticBooleanMethodA", "CallStaticByteMethod", "CallStaticByteMethodV", "CallStaticByteMethodA", "CallStaticCharMethod", "CallStaticCharMethodV", "CallStaticCharMethodA", "CallStaticShortMethod", "CallStaticShortMethodV", "CallStaticShortMethodA", "CallStaticIntMethod", "CallStaticIntMethodV", "CallStaticIntMethodA", "CallStaticLongMethod", "CallStaticLongMethodV", "CallStaticLongMethodA", "CallStaticFloatMethod", "CallStaticFloatMethodV", "CallStaticFloatMethodA", "CallStaticDoubleMethod", "CallStaticDoubleMethodV", "CallStaticDoubleMethodA", "CallStaticVoidMethod", "CallStaticVoidMethodV", "CallStaticVoidMethodA", "GetStaticFieldID", "GetStaticObjectField", "GetStaticBooleanField", "GetStaticByteField", "GetStaticCharField", "GetStaticShortField", "GetStaticIntField", "GetStaticLongField", "GetStaticFloatField", "GetStaticDoubleField", "SetStaticObjectField", "SetStaticBooleanField", "SetStaticByteField", "SetStaticCharField", "SetStaticShortField", "SetStaticIntField", "SetStaticLongField", "SetStaticFloatField", "SetStaticDoubleField", "NewString", "GetStringLength", "GetStringChars", "ReleaseStringChars", "NewStringUTF", "GetStringUTFLength", "GetStringUTFChars", "ReleaseStringUTFChars", "GetArrayLength", "NewObjectArray", "GetObjectArrayElement", "SetObjectArrayElement", "NewBooleanArray", "NewByteArray", "NewCharArray", "NewShortArray", "NewIntArray", "NewLongArray", "NewFloatArray", "NewDoubleArray", "GetBooleanArrayElements", "GetByteArrayElements", "GetCharArrayElements", "GetShortArrayElements", "GetIntArrayElements", "GetLongArrayElements", "GetFloatArrayElements", "GetDoubleArrayElements", "ReleaseBooleanArrayElements", "ReleaseByteArrayElements", "ReleaseCharArrayElements", "ReleaseShortArrayElements", "ReleaseIntArrayElements", "ReleaseLongArrayElements", "ReleaseFloatArrayElements", "ReleaseDoubleArrayElements", "GetBooleanArrayRegion", "GetByteArrayRegion", "GetCharArrayRegion", "GetShortArrayRegion", "GetIntArrayRegion", "GetLongArrayRegion", "GetFloatArrayRegion", "GetDoubleArrayRegion", "SetBooleanArrayRegion", "SetByteArrayRegion", "SetCharArrayRegion", "SetShortArrayRegion", "SetIntArrayRegion", "SetLongArrayRegion", "SetFloatArrayRegion", "SetDoubleArrayRegion", "RegisterNatives", "UnregisterNatives", "MonitorEnter", "MonitorExit", "GetJavaVM", "GetStringRegion", "GetStringUTFRegion", "GetPrimitiveArrayCritical", "ReleasePrimitiveArrayCritical", "GetStringCritical", "ReleaseStringCritical", "NewWeakGlobalRef", "DeleteWeakGlobalRef", "ExceptionCheck", "NewDirectByteBuffer", "GetDirectBufferAddress", "GetDirectBufferCapacity", "GetObjectRefType" ]After VM initialize the function table, the JNIEnv base address needs to be determined. In fact, here we will have determined the starting address where the whole table is checked.
By querying the detected pointer over gdb, I display the memory contents at a given address using the specified format. It represents the functions in the 230 pointer function table.
Java.perform(function(){
    jnienv_addr = Java.vm.getEnv().handle.readPointer();
});
console.log("[...] JNIEnv base adress -> " + jnienv_addr)
[...] JNIEnv base adress -> 0xefe4aab40xefe4aab4 <_ZN3artL21gCheckNativeInterfaceE>: 0x0 0x0 0x0 0x0
0xefe4aac4 <_ZN3artL21gCheckNativeInterfaceE+16>: 0xef877f80 0xef878820 0xef879140 0xef879a40
0xefe4aad4 <_ZN3artL21gCheckNativeInterfaceE+32>: 0xef87a330 0xef87ac20 0xef87b4f0 0xef87bdd0
0xefe4aae4 <_ZN3artL21gCheckNativeInterfaceE+48>: 0xef87c6b0 0xef87cf80 0xef87d870 0xef87e230
0xefe4aaf4 <_ZN3artL21gCheckNativeInterfaceE+64>: 0xef87ead0 0xef87f330 0xef87fb90 0xef880440
0xefe4ab04 <_ZN3artL21gCheckNativeInterfaceE+80>: 0xef880d20 0xef8815d0 0xef881610 0xef881650
0xefe4ab14 <_ZN3artL21gCheckNativeInterfaceE+96>: 0xef881690 0xef881f70 0xef881fb0 0xef882890
. . . . .
. . . . .
After the Array list was inserted into the forEach loop, it continued with JNIEnv functions, except for NULL values;
In addition, we reserve a number of additional
Chapter 4: JNI Functions From OracleNULLentries near the beginning of the function table, so that, for example, a future class-related JNI operation can be added after FindClass, rather than at the end of the table.
The indexes of other objects other than NULL are multiplied by 4 due to the x86 architecture. 32-bit corresponds to this. Then, the offset value in the calculation is added to the CheckNativeInterface address, which is the JNIEnv base address. Likely on gdb; x/100 0xefe4aab4
The address of the triggered JNI function outputs as 0xef88a6e0. The function name corresponding to this address is NewStringUTF.
return (*env).NewStringUTF("libx Loaded!");So how will this function be used?
JNINativeInterface.forEach(function(func_name) {
    if (!func_name.includes("NULL")) {
        var offset = JNINativeInterface.indexOf(func_name) * Process.pointerSize
        var func_addr = Memory.readPointer(jnienv_addr.add(offset))
        Interceptor.attach(func_addr, {
            onEnter: function(args) {
                console.log("[***] Enter Value -> " + args[0])
                console.log("[***] Func Name -> " + func_name)
                console.log("[***] Func Address -> " + func_addr)
            }
        })
    }

});
[***] Enter Value -> 0xeff29230
[***] Func Name -> NewStringUTF
[***] Func Address -> 0xef88a6e00xeff29230: 0xefe4aab4
0xefe4aab4 <_ZN3artL21gCheckNativeInterfaceE>
0xef88a6e0 <_ZN3art8CheckJNI12NewStringUTFEP7_JNIEnvPKc>The Java.vm.getEnv() method should be used as the variable defined for the JNIEnv base address. Thus, the returned value will be manipulated with its counterpart in the function table.
onLeave: function(args) {
	const retVal = Java.vm.getEnv().newStringUtf("Hooking Successful!")
	args.replace(retVal)
	Interceptor.detachAll()
}
Now let’s evaluate this for root detection.
Returning 0x1 value on rooted device is not processed in JNIEnv function. This was also seen in the title of Disassemble. However, when the function name was intercepted, the function name DeleteGlobalRef appeared. This is not a function of the return value, but a garbage collection function since the last reference is no longer needed.
For this reason, it is sufficient to replace the args value with 0x0.
APPENDIX: HOOKING VIA PATTERN
If you think you are wasting time on the offset calculation or detection process, you can hook the target function by performing a memory scan over the pattern.
In the previous thread, I was listing all libs because of the forEach loop. Therefore, I defined the address to be triggered directly in the findModuleByName part. After disassembling, I defined the pattern of the function to the variable via “Copy Byte String”.
During the specified address size, there may be a problem in the memory due to privilege. Because of this situation, read-write permission has been given to the addresses related to the protect method(Not required for me).
var m = Process.findModuleByName(libs);
var result = Memory.protect(m.base, m.size, "rwx");
var pattern = "55 89 e5 53 57 56 83 e4 f0 83 ec 50 e8 00 00 00 00 58 81 c0 a7 ac 02 00 8b 4d 0c 8b 55 08 65 8b 35 14 00 00 00 89 74 24 48 8d b0 14 4a ff ff 89 e7 89 77 04 8d 74 24 38 89 37 89 c3 89 44 24 20 89 4c 24 1c 89 54 24 18 89 74 24 14 e8 8f f8 ff ff 89 e0 8b 4c 24 14 89 08 8b 5c 24 20 e8 5e 01 00 00 8b 4c 24 20 8d 91 23 4a ff ff 89 e6 89 56 04 89 06 89 cb e8 76 f8 ff ff 89 44 24 10 e9 00 00 00 00 8b 44 24 10 89 44 24 30 83 7c 24 30 00 0f 84 45 00 00 00 8b 44 24 30 89 e1 89 01 8b 5c 24 20 e8 59 f8 ff ff e9 00 00 00 00 c6 44 24 37 01 c7 44 24 24 01 00 00 00 e9 2a 00 00 00 89 44 24 2c 89 54 24 28 8d 44 24 38 89 04 24 8b 5c 24 20 e8 3a f8 ff ff e9 47 00 00 00 c6 44 24 37 00 c7 44 24 24 01 00 00 00 89 e0 8d 4c 24 38 89 08 8b 5c 24 20 e8 17 f8 ff ff 8a 54 24 37 65 a1 14 00 00 00 8b 4c 24 48 39 c8 88 54 24 0f 0f 85 1f 00 00 00 8a 44 24 0f 0f b6 c0 8d 65 f4 5e 5f 5b 5d c3 8b 44 24 2c 89 04 24 8b 5c 24 20 e8 7d d9 01 00 8b 5c 24 20 e8 95 f7 ff ff 90 8d 74 26 00"
The relevant pattern has been scanned and matched in the memory range we have given. After the matched address(triggered address) during scanning, the return value of NativePointer was manipulated by intercepting it.
Memory.scan(m.base, m.size, pattern, {
            onMatch: function(address, size) {
                console.log('\n[***] Triggered Function found at -> ' + address);
                Interceptor.attach(address, {
                    onEnter: function(args) {
                        console.log("[***] Enter Value -> " + args[0])
                    },
                    onLeave: function(args) {
                        console.log("[***] Before Hooking RetVal-> " + args)
                        args.replace(0x0);
                        console.log("[***] After Hooking RetVal-> " + args)
                    }
                });

            }
CONCLUSION

I don’t know what conclusion to draw from this article. I can only say this; It really satisfied me to learn the subject more deeply, step by step, not being lazy to research and learning. In addition, it seems that it will be useful for my next article to have different topics shaped in my head while learning in depth.
It may not be my place to give advice, but researching the subjects you enjoy will motivate you. Mixing the area you are particularly interested in and the areas you are curious about will satisfy you even more.
I continue to research and learn in the field of mobile security, I will continue…
Shinzou wo Sasageyo!